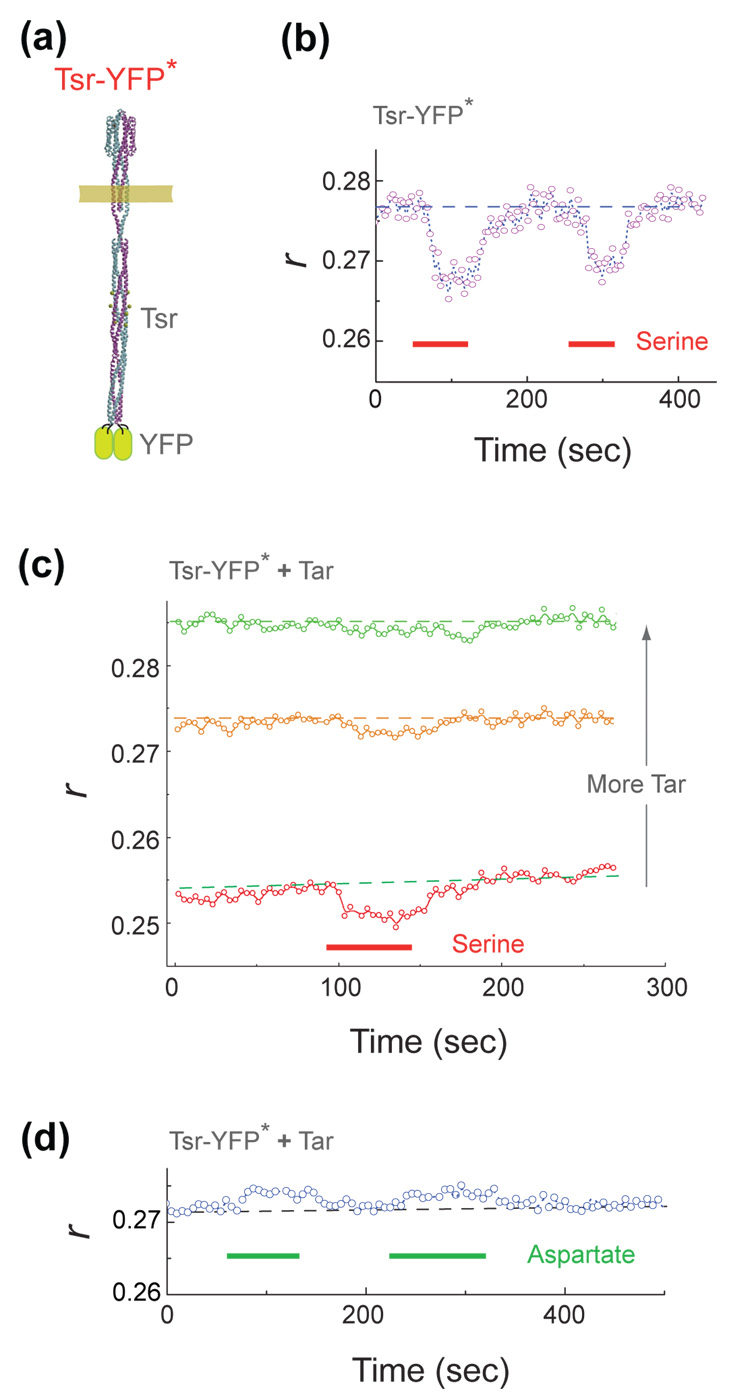
Figure 3.
Anisotropy traces with YFP fused to the cytoplasmic tip of a receptor homodimer. (a) The position of YFP in the construct Tsr-YFP*: tsr1-390–yfpA206K –tsr390-end cloned into pTrc99A vector to form plasmid pAV48. (b) An anisotropy trace (see legend of Fig. 1) recorded from flhD cells expressing Tsr-YFP* (induced using 5 µM IPTG). Serine was added for the time intervals indicated by the red bars. (c) Similar traces recorded from cells co-expressing Tsr-YFP* with increasing levels of Tar (induced using increasing concentration of sodium salicylate from plasmid pLC113, a gift of Sandy Parkinson): reading from bottom to top: 0, 0.5, and 1.2 µM sodium salicylate. Cells were stimulated by addition of serine for the time interval indicated by the red bar. (d) Anisotropy traces recorded from cells co-expressing Tsr-YFP* with an intermediate level of Tar (0.7 µM sodium salicylate) and stimulated by addition of aspartate for the time intervals indicated by the green bars. Dashed lines indicate the anisotropies observed in the absence of ligand and are a guide to the eye.

