
Fig. 6.
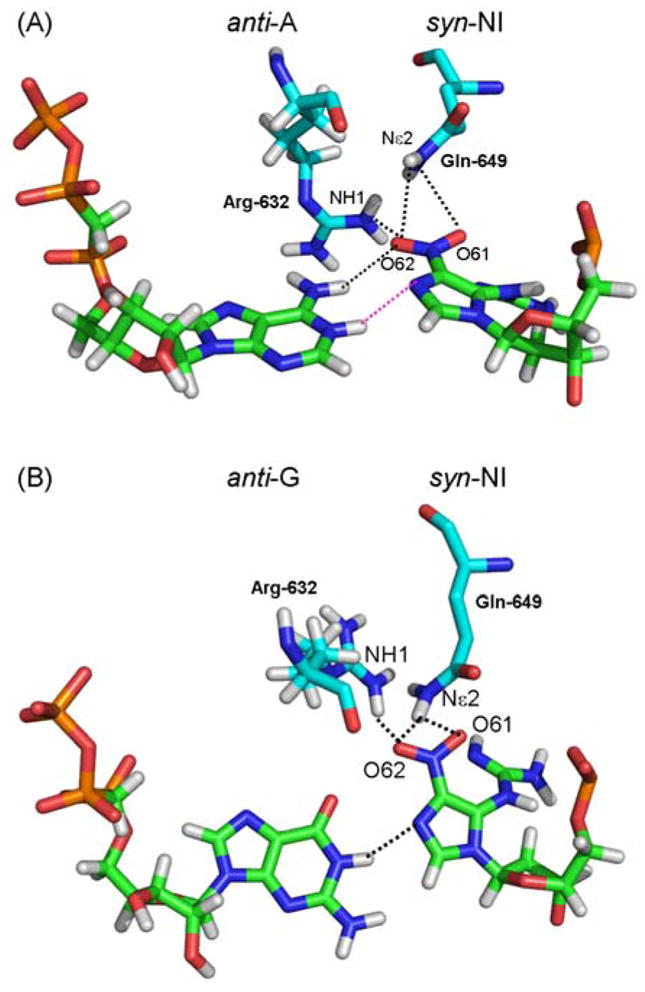
Hydrogen bond network between syn-NI and T7 RNAP residues Arg632 and Gln649. (A) anti-A:syn-NI and (B) anti-G:syn-NI pairs show the NI in a syn conformation, which is stabilized by one hydrogen bond involving the O62 of NI and the NH1 of Arg632, and a bifurcated hydrogen bond between O61 and O62 of NI and Nε2 of Gln649. The ATP and GTP partners are shown to illustrate the difference in torsions adopted by the NI lesion in each case. Hydrogen bonds are shown as dotted black lines. Hydrogen bond involving the protonated adenine is shown in pink.