Figure 9.

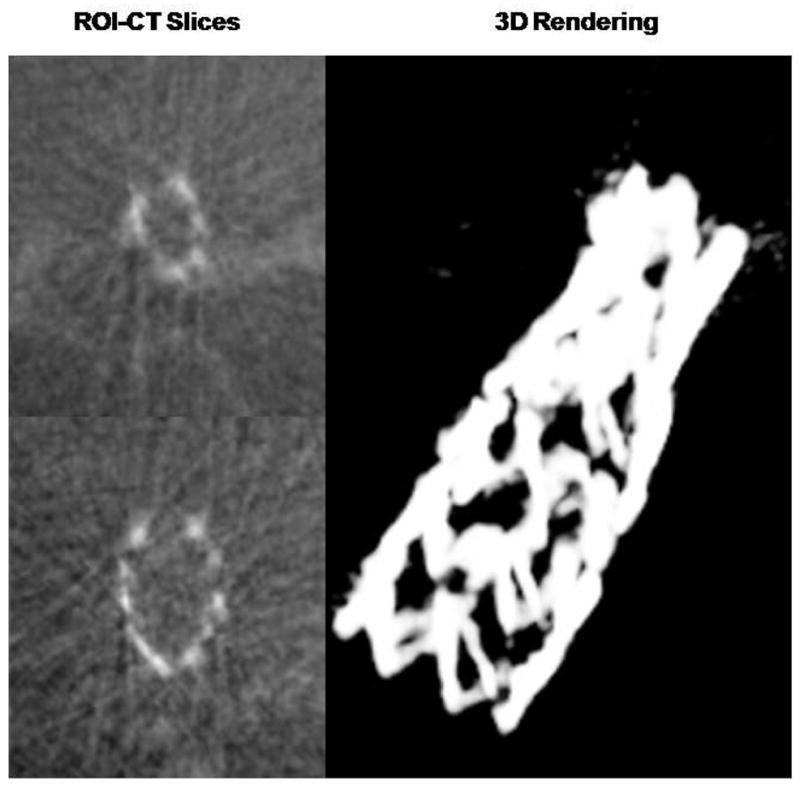
ROI-CT slices at two different levels and a 3D rendering showing the full stent in the rabbit brain vasculature. The projection data was acquired using both the HSMAF and the FP as indicated in Figure 8

ROI-CT slices at two different levels and a 3D rendering showing the full stent in the rabbit brain vasculature. The projection data was acquired using both the HSMAF and the FP as indicated in Figure 8