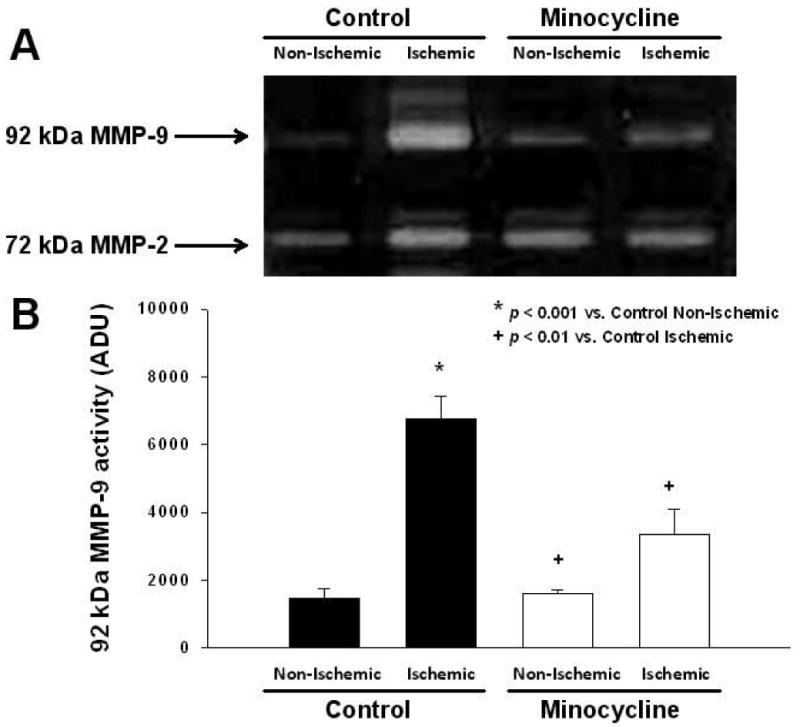
Figure 2. Reduction of MMP-9 levels in the ischemic region with minocycline treatment.

A. Representative gelatin zymography of myocardial MMP-2 and MMP-9 levels in I/R control (n=4) and minocycline-treated (n=5) hearts. B. Bar graph derived from densitometric analysis of 92 kDa MMP-9 zymographic activity in control (non-ischemic and ischemic) and minocycline-treated (non-ischemic and ischemic) hearts regions. Values are mean ± S.E.M.
