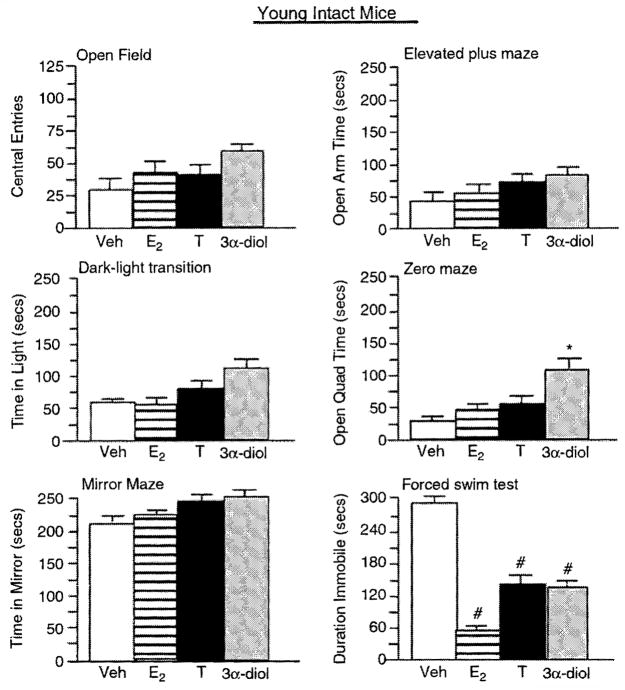
Figure 2.
Represents mean affective behavior for young, intact male mice administered vehicle control (white bar), E2 (horizontally-striped bar), T (black bar), or 3α-diol (gray bar) in the open field (upper left panel), elevated plus maze (upper right panel), dark–light transrtion (middle left panel), zero maze (middle right panel), mirror maze (lower left panel), and forced swim (lower right panel) tasks, *Significant difference (P<0.05), #denotes significant trend (P<0.10).

