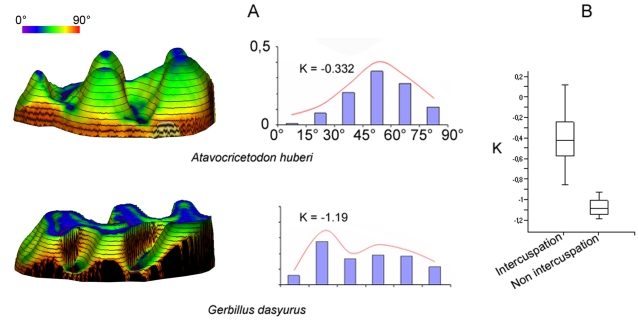
Figure 3. Topographic investigation of tooth crown planation in mammals.
A: Topography of the left first upper molars of Atavocricetodon huberi and Gerbillus dasyurus, and the associated histograms of slope value distribution on the tooth crown, with values of Kurtosis K calculated for both taxa (3D slope map with superimposed contour lines computed with Surfer for Windows). B: Box plots showing K value distribution of Muroidea displaying cusp interlocking (n = 23, mean = −0,415) and Muroidea displaying no cusp interlocking (n = 4, mean = −1,08). Mean K values are significantly different between both groups (Student t test: P<0,001).

