
Figure 5.
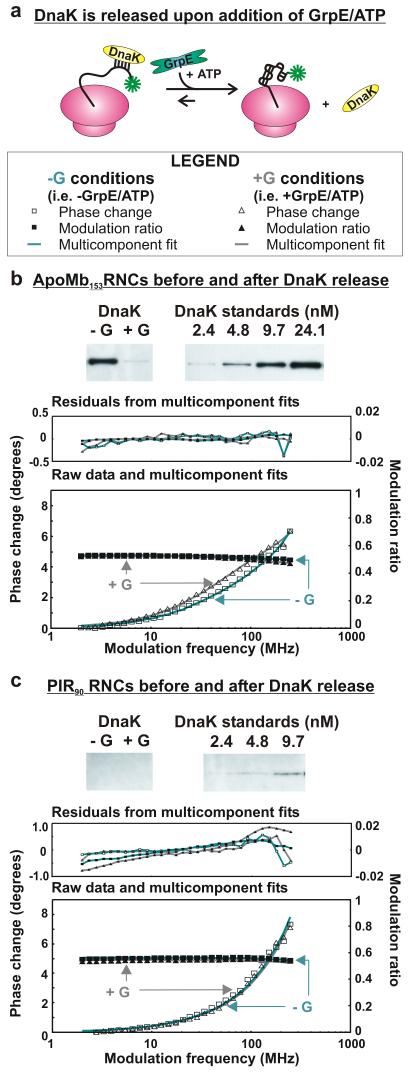
Dynamic fluorescence depolarization of RNCs generated in a trigger factor-depleted (Δtig) cell-free system, before and after release of DnaK. a) Illustration of DnaK release induced by the addition of 2 μM GrpE, 30 μM ATP, and 500 μM KCl (+G conditions). b) Western blot showing that the concentration of apoMb153-RNC-bound DnaK is significantly reduced under +G conditions. This panel also shows the phase shift of the frequency domain fluorescence anisotropy of apoMb153-RNC upon release of DnaK. The shift corresponds to an enhancement in the fraction of ns motions. c) Western blot and fluorescence analysis (as in panel b) of PIR90. No shift from a 2-component fit is detected under +G conditions. Each experiment in panels b and c was repeated 3 times.