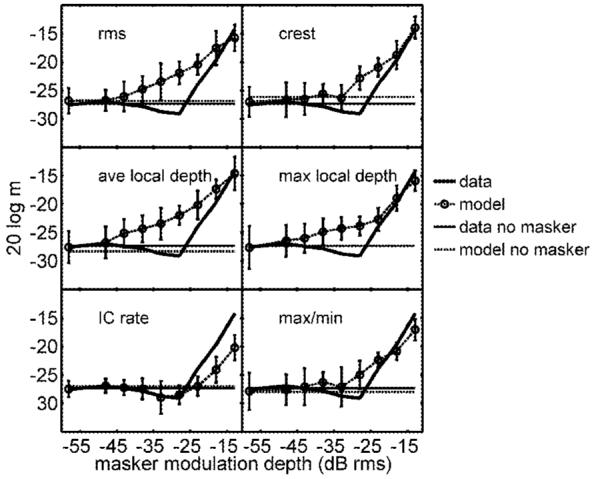
FIG. 5.

Model thresholds from simulated tracks based on six DVs (o), along with the listeners’ fixed-level data from Fig. 2 (solid lines, no symbols). Unmasked (pure) SAM detection thresholds are shown with the solid horizontal lines. Unmasked model thresholds (thick dashed lines) were set by adding a fixed-variance internal noise to the DV in each interval. Predictions based on long-term DVs are shown in the left column; local temporal features were included in the simulations summarized in the right column.
