FIG. 6.

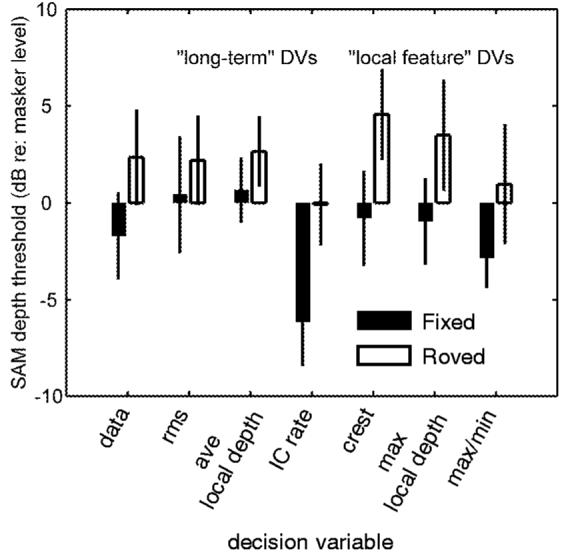
Roving-level masker simulations and comparison with listeners’ mean data. The format is the same as Fig. 3, but the thresholds of different DVs are shown instead of the performance of different listeners.

Roving-level masker simulations and comparison with listeners’ mean data. The format is the same as Fig. 3, but the thresholds of different DVs are shown instead of the performance of different listeners.