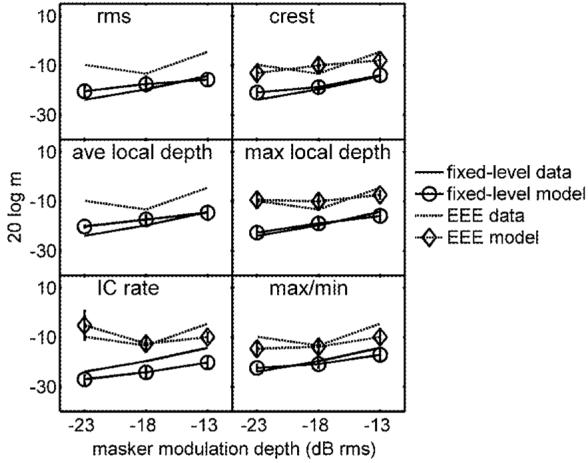
FIG. 7.

Comparison of measured thresholds (lines with no symbols) and predicted thresholds (connected symbols with error bars) for EEE (dashed lines) and fixed-level conditions (solid lines). DVs are arranged as in Fig. 5. If a given combination of DV and masker condition resulted in overmodulation or tracks that did not converge, simulated thresholds were not plotted (this occurred with the rms and average local depth DVs in EEE conditions).
