
Figure 6.
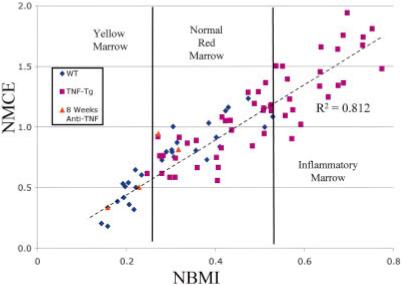
Thresholds of yellow marrow, red marrow, and pathologic inflammatory bone marrow edema signals. Linear regression analysis of NBMI versus NMCE in the WT and TNF-Tg mice shown in Figure 1 and in anti-TNF-treated TNF-Tg mice after 8 weeks of therapy showed a highly significant association (R2 = 0.812, P < 0.0001), using Pearson’s correlation coefficient. Three groups of mice were differentiated in this plot. The first group was mice with yellow marrow and low values of both NBMI and NMCE. This group was composed exclusively of adult WT mice and 2 of the 4 anti-TNF-treated animals. The second group was mice with normal red marrow patterns and consisted of young WT mice, prearthritic TNF-Tg mice, and 2 of the 4 anti-TNF-treated mice. The third group contained only TNF-Tg mice with abnormal red marrow. See Figure 1 for definitions. Color figure can be viewed in the online issue, which is available at http://www.arthritisrheum.org.