
FIG. 10.
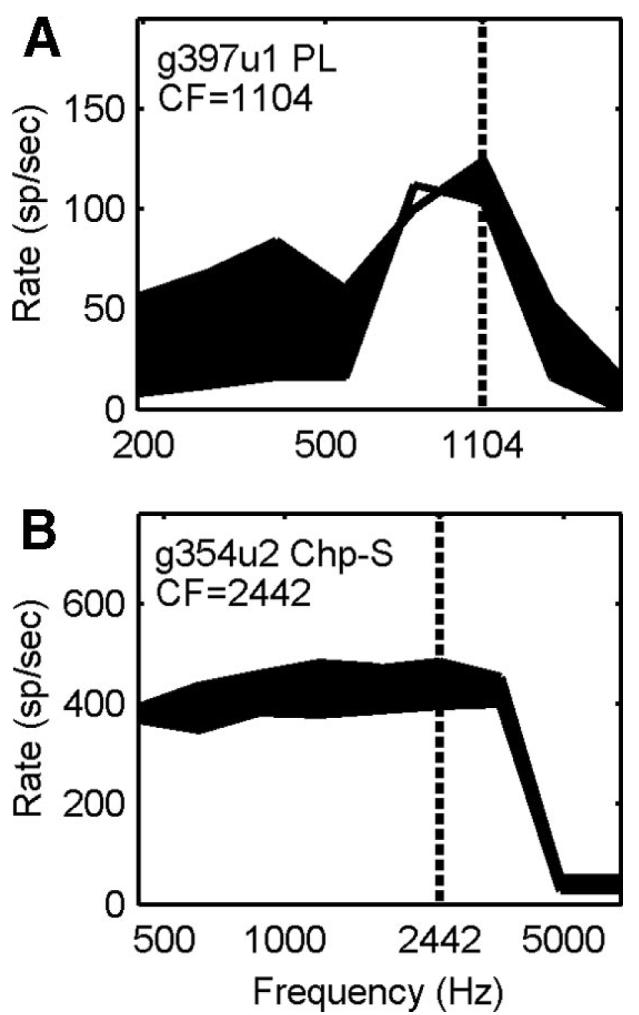
Frequency-response areas for a PL (A) and a Chp-S (B). The tone level was 80 and 70 dB SPL for the two neurons, respectively. Shaded areas indicate rate increase after blocking GABAergic inhibition with gabazine. The vertical dotted lines indicate neuron CFs.