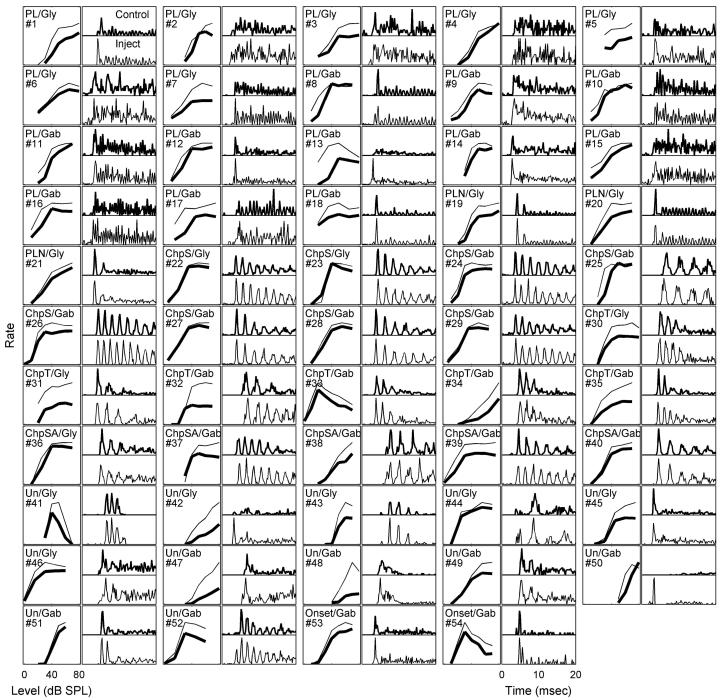
FIG. 6.
Rate-level functions (odd-numbered columns) and PSTHs (even-numbered columns) in response to CF tones for all neurons before and after blocking glycinergic (Gly) or GABAergic (Gab) inhibition. In the rate-level plots, thick lines are average rates before injection and thin lines are maximum average rates during or after injection. In the PSTH plots, top panels are PSTHs before injection and bottom panels are PSTHs for responses with maximum average rates during or after injection. All PSTHs are responses to the highest-level CF tones studied (60-80 dB SPL).

