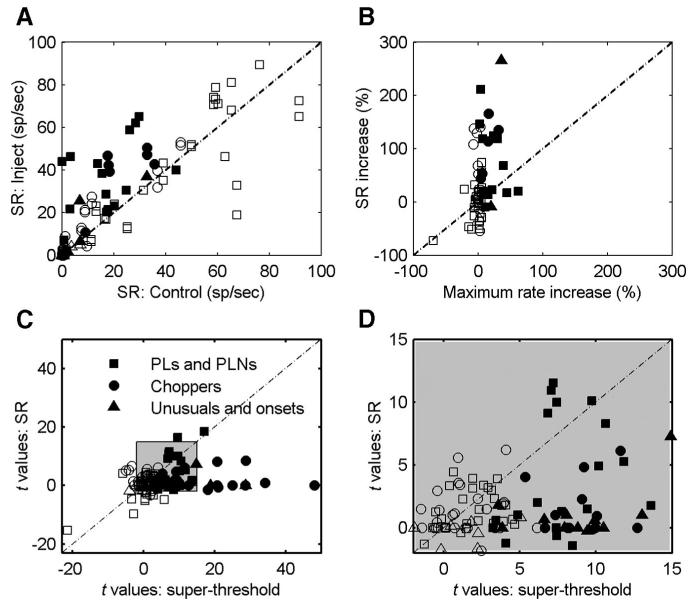
FIG.9.
A: spontaneous rate (SR) before and after blocking glycinergic or GABAergic inhibition. B: percentage of increase of SR vs. percentage of increase of the maximum sound-evoked rate across tone levels after blocking inhibition. Only neurons with control SR >5 spikes/s are plotted. C and D: change in spontaneous rate compared with change in sound-evoked rate after blocking inhibition in terms of t values. D is the shaded area in C. Open/filled symbols indicate neurons with negative/positive effects.

