Fig. 5.
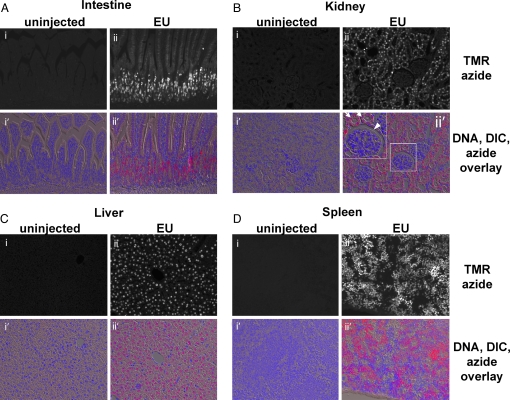
Imaging total RNA synthesis in vivo by using EU. Tissues from a EU-injected mouse (2 mg EU) and an uninjected control littermate were harvested and fixed 5 h later. Tissue sections were stained with 25 μM TMR-azide and Hoechst. The black-and-white images are fluorescent micrographs of mouse tissues stained with TMR-azide. The color images are overlays of fluorescent azide (red), fluorescent DNA (blue), and DIC micrographs of the sectioned tissues. (A) Villi of the small intestine seen in longitudinal section. Actively transcribing cells are located in the crypts and the base of the villi; EU staining is much weaker but clearly visible in the cells along villi. (B) Kidney. Kidney tubules (the two arrows in the Inset of ii′) show strong EU staining; EU-labeled RNA is strikingly absent from glomeruli (the arrowhead in the Inset of ii′). (C) Liver. All hepatocytes show strong EU staining, whereas staining is absent in cells located at the periphery of liver lobules. (D) Spleen. A large subset of the lymphocytes seen in spleen sections show very intense EU staining; however, EU incorporation is absent from some of the cells, indicating dramatically different levels of bulk transcriptional activity.

