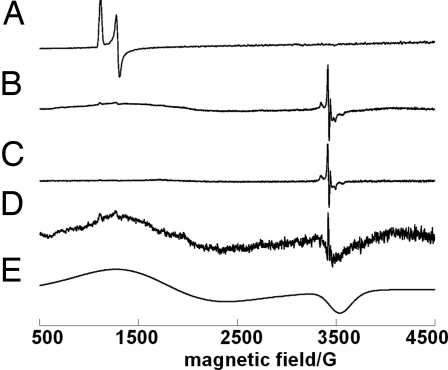
Fig. 3.
EPR spectra of Cld in ferric form (A), during turnover with chlorite (B), same conditions as B but after warming to near the melting temperature (C), difference spectrum (B − C) (D), simulation of the axial S = 3/2 signal with g⊥ = 4.5, and g‖ = 1.99 (E). Concentration of enzyme and chlorite are 6.4 × 10⁻⁶ M and 1.0 M, respectively, in 0.010 M sodium phosphate buffer, pH 7.0. EPR spectra were recorded at 5 K.

