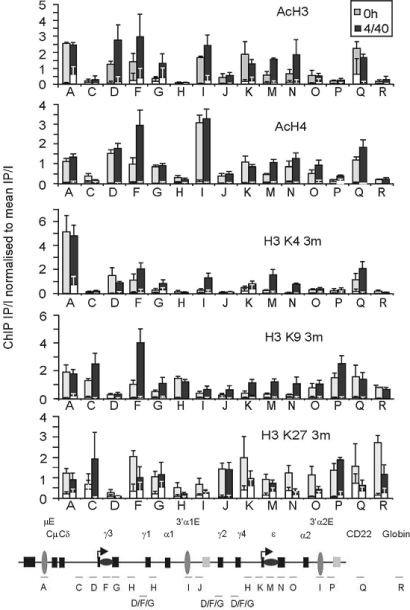
Fig. 2.
Analysis of histone modifications across the Ig heavy-chain locus. Histone modification patterns across the locus were analyzed by performing ChIP on mononucleosomes and dinucleosomes, recovered from micrococcal nuclease treated, native chromatin isolated from B cells immediately after purification (0 h) or after 48-h culture with IL-4/anti-CD40 (+4/40). The distribution of each histone modification was determined by qPCR and normalized to the amount of “input” DNA and mean efficiency of the immuno-precipitation. Mean data are shown from total B cells isolated from four donors, errors bars show SEM. IP signal obtained from the IgG controls are shown in white. The location of the Taqman primer sets used for this analysis are depicted on the diagram of the locus below the graph (not to scale). Note that primers D, E, F, G, H, and I hybridize to multiple regions across the locus. Levels of H3 and H4 acetylation (AcH3 and AcH4), H3 trimethylated at lysine 4 (H3 K4 3m), histone H3 trimethylated at lysine 9 (H3 K9 3m), and lysine 27 (H3 K27 3m) are shown.

