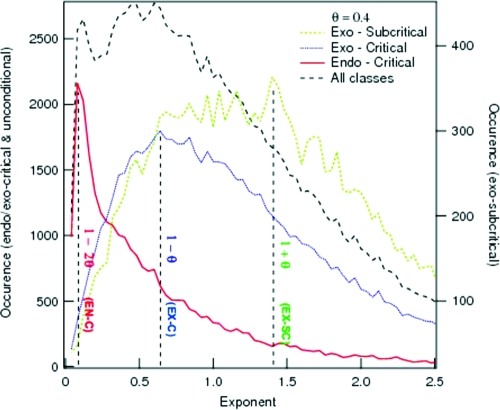
Fig. 4.
Histogram of all of the exponents of the power-law relaxation ∼ 1/tp of the view counts following a peak (black dashed line). The bimodal distribution provides evidence of the existence of at least two dynamic classes in the absence of conditioning. A more refined analysis based on the peak fraction F reveals three distinct distributions belonging respectively to Class 1 (dashed green line), Class 2 (dotted blue line) and Class 3 (continuous red line). The predicted values for the exogenous subcritical class (Eq. 3), exogenous critical class (Eq. 4) and for the endogenous critical class (Eq. 5) are shown by the vertical dashed lines with their quantitative values determined with the choice θ = 0.4.

