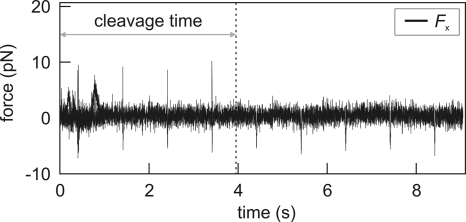
Fig. 2.
Typical data trace of a cleavage event. Displayed is the force on the DNA in the direction along the stretched molecule. Every second, the DNA is rapidly stretched to ≈5–10 pN, resulting in sharp positive force spikes (negative spikes are caused by the fast movement of the beads and do not represent a real force on the DNA). Disappearance of these spikes implies that the DNA molecule has been cleaved in the preceding second. The best estimate for this event is exactly halfway between the last spike and the next stretching attempt. We thus define the reaction time as the time between transportation of the DNA construct into the enzyme-containing flow channel (t = 0 in the graph) and last upward spike plus 0.5 s. The statistical error that is introduced in the measured cleavage time (≈0.5 s) averages out for the large number of data points.

