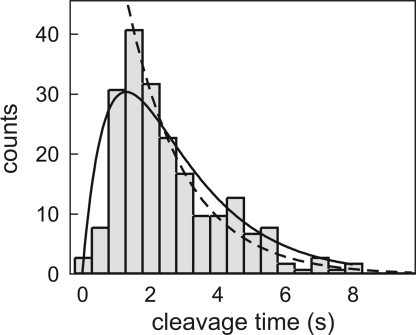
Fig. 3.
Determination of DNA hydrolysis rate, obtained with 500 nM EcoRV in reaction buffer with 100 mM NaCl. Because in the optical tweezers experiments only the cleavage of the second strand is observed, the distribution of cleavage times shows a lag phase. The single exponential fit (dashed line) gives a strand cleavage rate k1 of 0.60 ± 0.03 s−1 for the second strand. Because of degeneracy, cleavage of the first strand should in principle be twice as fast. As a result, the rate of hydrolysis for both DNA strands is 0.40 ± 0.03 s−1. The average time required for DNA cleavage is the inverse, 2.5 ± 0.2 s. The full distribution can also directly be fitted with such a two-step process (k1[exp(−k1t) − exp(−2k1t)]). Doing so (solid line) yields a strand cleavage rate k1 of 0.54 ± 0.03 s−1, comparable to the rate found above.

