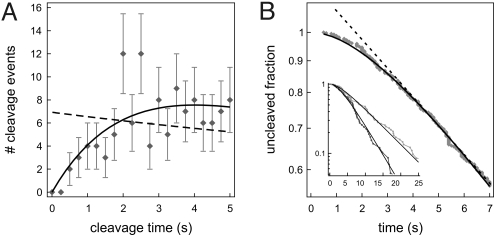
Fig. 6.
The effect of hydrolysis on the measured cleavage rates, performed on data taken in 100 mM NaCl. For increased statistics data from all DNA conformations are combined here. (A) The first part of the distribution of cleavage times (0.25-s time bins) shows a lag phase caused by the presence of DNA hydrolysis as a second step in the reaction. The dashed line is the single-exponential fit (to the full distribution), and the solid curve is the fit for a two-step process. The hydrolysis rate (for the cleavage of both DNA strands) obtained by the fit is 0.4 ± 0.1 s−1, in accordance with the direct measurements of this parameter (Fig. 3). (B) Probability distribution of cleavage time, constructed from the same data as in A. Also in this representation a two-step process (solid line) describes the data more accurately than a single exponential (dashed line), signifying the presence of DNA hydrolysis (again with a rate of 0.4 ± 0.1 s−1). (Inset) Probability distributions for data subsets with the smallest (black) and largest (gray) fractional extensions. Although this method may provide an “easy way out” for fitting both hydrolysis and association rate, the uncertainties of the fits are ill-defined, as the individual data points in this cumulative representation are not independent.

