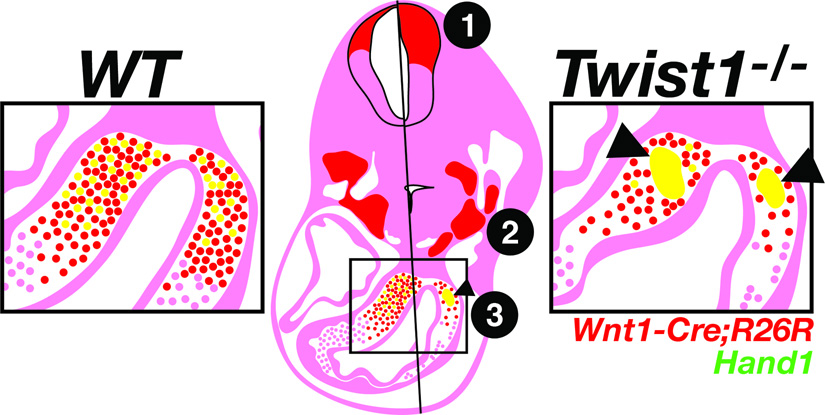
Figure 8. Schematic representation of the NCC phenotypes associated with a loss of Twist1.
Phenotypes are depicted for the Twist1−/− (left) compared to the wild-type (right) at E11.5. 1) Denotes expansion of the Wnt1-Cre lineage (red) in the dorsal neural tube. 2) Denotes abnormal condensation of the mesenchyme within the pharyngeal arches. 3) Denotes aggregation of the Hand1-expressing subpopulation of cNCCs (yellow) in the OFT cushions.

