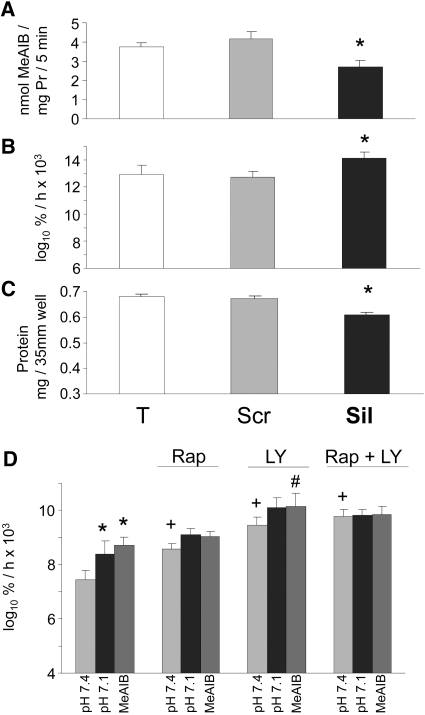
Figure 4.
(A through C) Effect of siRNA silencing of SNAT2 in L6-G8C5 myotubes. Pooled data from three independent experiments are shown (with three replicate culture wells for each treatment). T, cultures incubated with calcium phosphate transfection blank; Scr, scrambled control siRNA; Sil, SNAT2 silencing siRNA. Transfection was followed by an 8-h incubation in DMEM + 10% FBS followed by 16 h in MEM + 2% dialyzed FBS. All measurements were then made in parallel as follows: SNAT2 transporter activity (A) and proteolysis rate during 24 h in MEM + 2 mM L-Phe + 2% dialyzed FBS at pH 7.4 (B). Cultures were prelabeled by incubating with 3H-L-Phe for 72 h (including the transfection incubation) before the delabeling measurements. (C) Protein content of the cultures in B. *P < 0.05 versus Scr control. (D) Effect of 100 nM rapamycin (Rap) and 12.5 μM LY294002 (LY) on proteolysis rate in L6-G8C5 myotubes as in Figure 3B during incubation at pH 7.1, pH 7.4, or pH 7.4 with 10 mM MeAIB in serum-free MEM with 100 nM insulin. *P < 0.05 versus the corresponding pH 7.4 control value; +P < 0.05 versus cultures at pH 7.4 without Rap or LY; #P < 0.05 versus cultures with 10 mM MeAIB without LY. Pooled data from four independent experiments are shown (with three replicate culture wells for each treatment).

