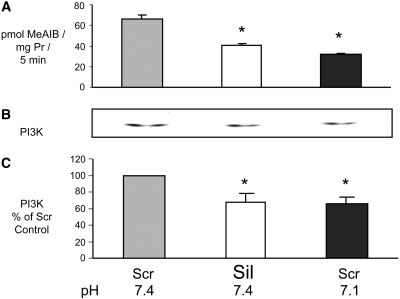
Figure 5.
Comparison of the effects of siRNA silencing of SNAT2 and of acidosis on PI3K activity in L6-G8C5 myotubes. Transfection (see Figure 4) was followed by 24 h in DMEM + 10% FBS. Cells were subjected to an additional 2-h incubation in serum-free MEM, at the specified pH with 100 nM insulin before preparing lysates for PI3K assay. (A) SNAT2 transporter activity assayed at the specified pH. (B) Representative autoradiograph of thin-layer chromatography plate showing 32P-labeled phosphatidylinositol-3-phosphate generated by the PI3K lipid kinase reaction (see the Concise Methods section). (C) Quantification by densitometry of data pooled from three independent experiments performed as in B, expressed as percentage of the pH 7.4 Scr control value. *P < 0.05 versus the pH 7.4 Scr control.

