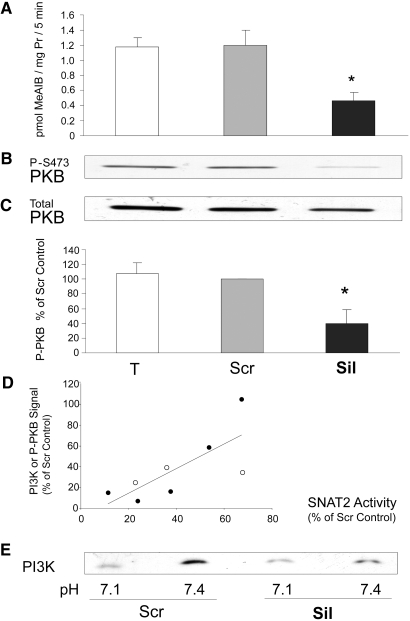
Figure 9.
(A through C) Effect of siRNA silencing of SNAT2 on PKB activation in L6-G8C5 myoblasts as in Figure 8. Experiments were run in parallel on the same cells. Pooled data from five independent experiments are presented. (A) SNAT2 transporter activity. (B) Representative immunoblot showing PKB activation assessed from phosphorylation of PKB at Ser 473. (C) Quantification by densitometry of pooled experiments performed as in B, expressed as percentage of the Scr control value. *P < 0.05 versus the Scr control. (D) Correlation between the degree of silencing of SNAT2 and the accompanying degree of inhibition of the P-PKB and PI3K signals. Data are plotted from the five PKB experiments in A and C (•) and the three PI3K experiments in Figure 8, B and D (○). Spearman rank correlation coefficients: All data R = 0.74, P < 0.04; PKB data only R = 0.90, P < 0.04. (E) Representative experiment showing the effect of pH on the residual PI3K activity in myoblasts in which SNAT2 had been silenced as in Figure 8, but the ensuing 2-h incubation with 100 nM insulin was performed either at pH 7.1 or at pH 7.4.

