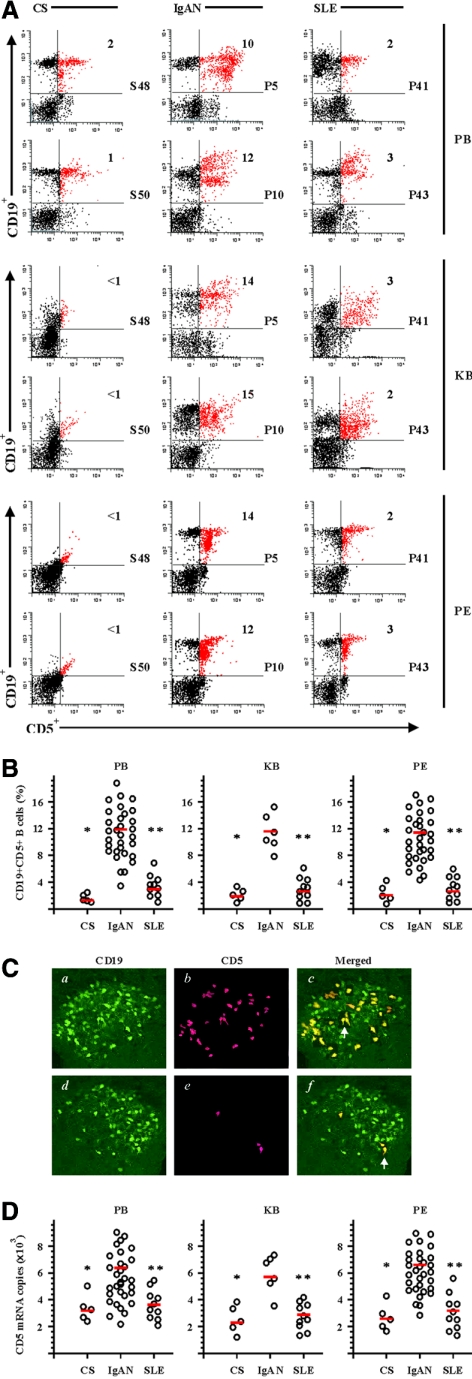
Figure 1.
Increased systemic and local frequency of CD19+CD5+ B cells in patients with IgAN. The cell suspensions were obtained as described in the Concise Methods section. (A) Dual-color flow cytometric analysis of CD19+CD5+ B cells in peripheral blood (PB), cell suspensions from kidney biopsy (KB), and peritoneal fluids (PF) from control subjects (CS), patients with IgAN, and patients with SLE. The cells were freshly isolated and stained with CD19-PE and CD5-FITC. Dot plots were generated after gating on mononuclear cells and show the expression of CD5 relative to CD19. The indicated numbers in the graphs were percentages of CD19+CD5+ B cells. The data shown were from representative patients (S48, S50, P5, P10, P41, and P43) of five (CS), 36 (IgAN), and 10 (SLE) similar experiments performed. For simplification, the isotype Ab controls in the experiments are not shown. (B) CD19+CD5+ percentages for individual patients are shown. Mean values for each group are indicated by red bars. The decreased number of kidney biopsy samples (n = 6) from patients with IgAN was due to limited tissue availability. (C) CD19+, CD5+, and CD19+CD5+ B cell distribution in kidney biopsy from patients with IgAN (a through c) and patients with SLE (d through f). The specimens were stained and photographed under epifluorescence conditions. The arrows indicate typical CD19+CD5+ B cells. The images represent specimens analyzed from six patients with IgAN and six patients with SLE. (D) Q-PCR analysis for CD5 mRNA expression in PB, KB, and PF from CS, patients with IgAN, and patients with SLE. Purified CD19+ B cells were obtained as described in the Concise Methods section. All individual data from each Q-PCR analysis as well as the mean values are shown. *P < 0.01 by the Kruskal-Wallis test, after testing with Dunn method for multiple comparisons, showed a significant difference between patients with IgAN and CS; **P < 0.01 by the Kruskal-Wallis test, after testing with Dunn method for multiple comparisons, showed a significant difference between patients with IgAN and patients with SLE. Magnification, ×1200.

