Figure 2.
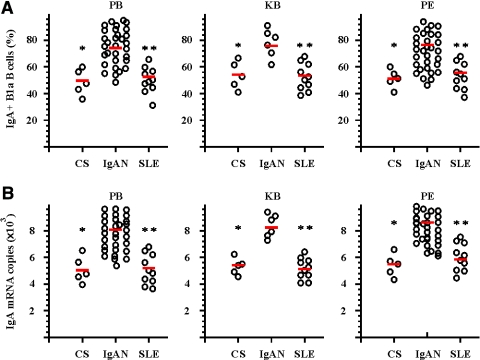
Elevated IgA expression on CD19+CD5+ B cells from patients with IgAN. Purified CD19+CD5+ B cells were obtained from PB, KB, and PF from CS, patients with IgAN, and patients with SLE as described in the Concise Methods section. (A) Results of triple-color flow cytometric analysis of sIgA expression on gated CD19+CD5+ B cells in PB, KB, and PF from CS, patients with IgAN, and patients with SLE. The cells were freshly isolated and stained with CD19-PE, CD5-FITC, and sIgA-RPE Cy5. The positive cell percentages from each individual patient's samples are shown. The red bars indicate the mean values of each groups. (B) Q-PCR results for IgA mRNA expression in PB, KB, and PF from CS, patients with IgAN, and patients with SLE. Purified CD19+CD5+ B cells were obtained from PB, KB, and PF from CS, patients with IgAN, and patients with SLE as described in the Concise Methods section. Dots indicate mRNA copy number from individual patients, and red bars indicate mean values per group. *P < 0.01 by the Kruskal-Wallis test, after testing with Dunn method for multiple comparisons, showed a significant difference between patients with IgAN and CS; **P < 0.01 by the Kruskal-Wallis test, after testing with Dunn method for multiple comparisons, showed a significant difference between patients with IgAN and patients with SLE.

