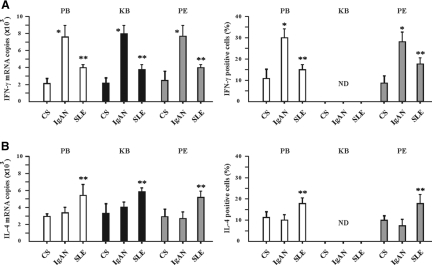
Figure 3.
Differential IFN-γ and IL-4 cytokine expression by CD19+CD5+ B cells from patients with IgAN and patients with SLE. (A and B) IFN-γ (A) and IL-4 (B) expression by CD19+CD5+ B cells in PB, cell suspensions of KB, and PF from CS, patients with IgAN, and patients with SLE was measured by Q-PCR (left) and intracellular cytokine flow cytometry (right). For Q-PCR analysis, the purified CD19+CD5+ B cells were obtained as described in the Concise Methods section. For intracellular cytokine flow cytometric analysis, the total cells were isolated; stimulated as described in the Concise Methods section; and stained with CD19-PE, CD5-FITC, and the cytokine antibodies conjugated to RPE Cy5 as indicated. ND, no determination. The illustrated data for IFN-γ and IL-4 mRNA and intracellular expression are expressed as means ± SD from CS (n = 5), patients with IgAN (n = 36), and patients with SLE (n = 10). Because of limited tissue availability from kidney biopsies, Q-PCR analysis was performed only on KB from CS (n = 5), patients with IgAN (n = 6), and patients with SLE (n = 10). *P < 0.01 by the Kruskal-Wallis test, after testing with Dunn method for multiple comparisons, showed a significant difference between patients with IgAN and CS; **P < 0.05 by the Kruskal-Wallis test, after testing with Dunn method for multiple comparisons, showed a significant difference between patients with IgAN and patients with SLE.

