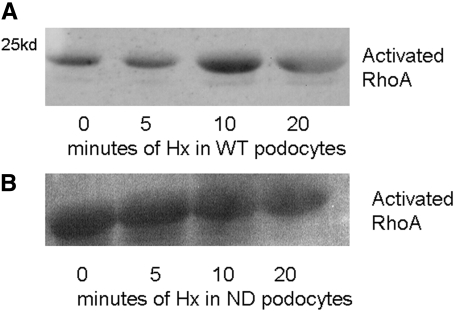
Figure 7.
Activated RhoA was determined using a GST pulldown assay. (A) WT podocytes had minimal basal activation of RhoA, and this increased after treatment with Hx. (B) ND podocytes had higher basal expression of RhoA, and this did not change after Hx treatment. Images are representative of n = 3 independent experiments.

