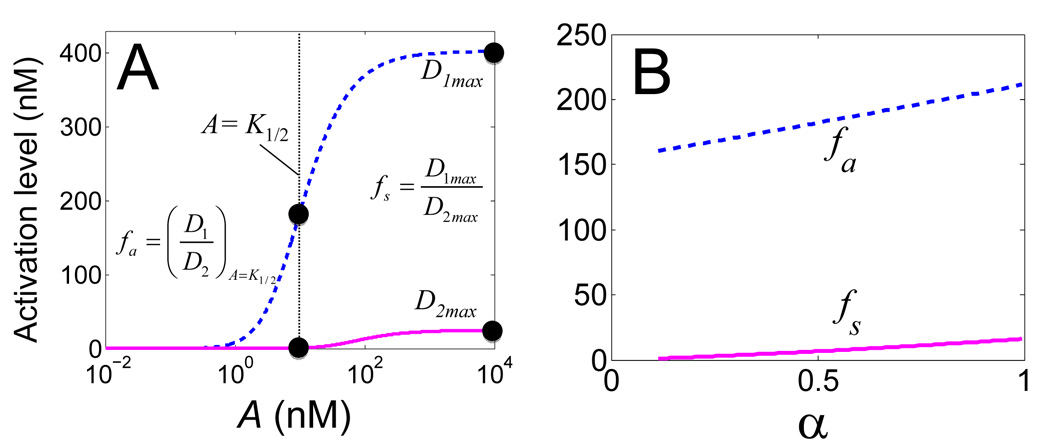
Figure 2. Quantifying fidelity in signal recognition using two metrics.
(A) Dose responses of D1 and D2 to A1 and A2 respectively. fa is evaluated at the signal concentration (K1/2) that leads to half-maximum induction of D1. fs is evaluated at a saturating signal concentration.
(B) Modulation of fidelity (fa or fs) by α (for β = γ =10), which characterizes the differential protein stabilization by A1 and A2. A similar trend is observed for other values of β and γ (Figure S1).

