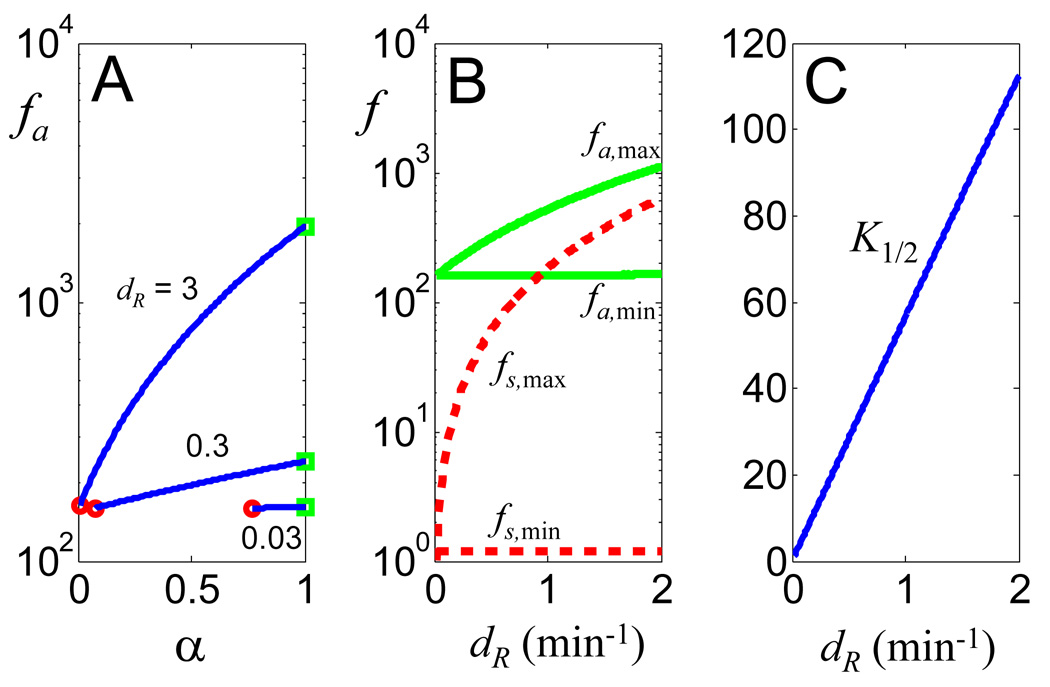
Figure 3. Increasing the R degradation rate constant enhances signaling fidelity.
(A) Dependence of fa on α for varying dR (β = γ = 10). Note that dR determines the range of α for a constant dR1 (= 0.023 min−1).
(B) Modulation of the maximal (α = 1) and minimal (α = dR1/dR) limits of fidelity by dR. For both metrics, the maximal fidelity increases with dR, but the minimal fidelty does not change with dR.
(C) The half-activation threshold (K1/2, nM) by the cognate signal increases with dR.

