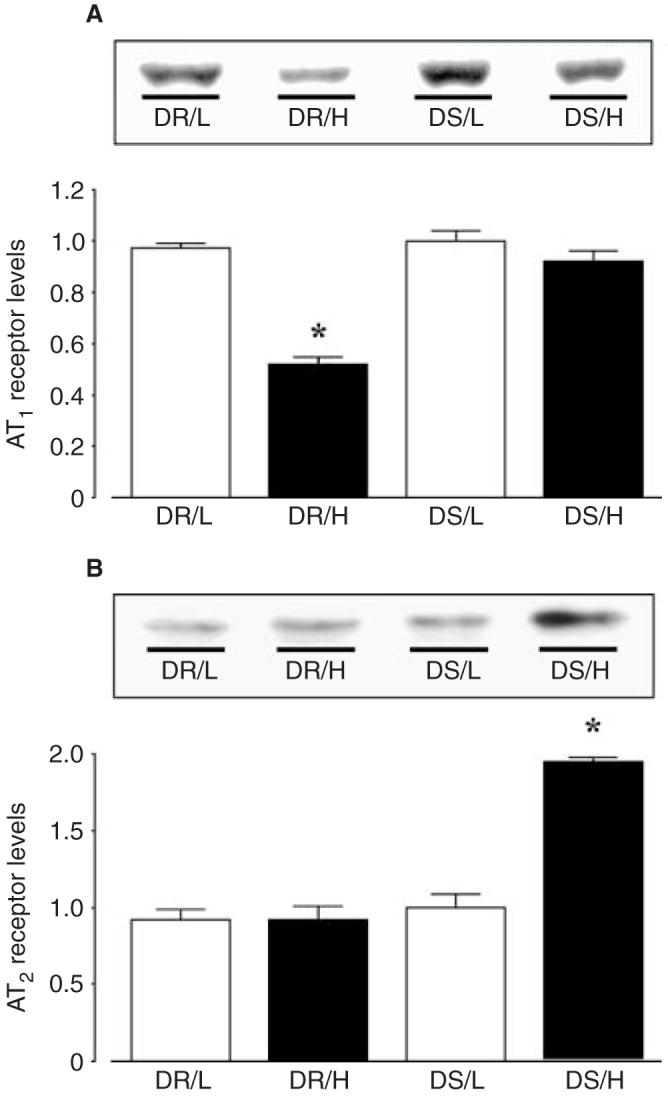
Fig. 4. Renal cortical (A) angiotensin II type 1 receptor AT1 and (B) AT2 receptor protein levels in Dahl rats.

All values were normalized by arbitrarily setting the densitometry of DS/L rats to 1.0. DR rats fed a high salt diet showed significantly reduced cortical tissue AT1 receptor protein levels compared with DR/L rats. However, cortical tissue AT1 receptor levels in DS rats were unaffected by a high salt diet. On the other hand, cortical tissue AT2 receptor levels were significantly increased in DS/H rats. As a control study to check for equal loading, membranes were reprobed with an antibody against β-actin. The results showed that the densitometric values were unaltered among the groups (data not shown). *P < 0.05 vs. the same strain on a low salt diet. DR rats, Dahl salt-resistant rats; DS rats, Dahl salt-sensitive rats.
