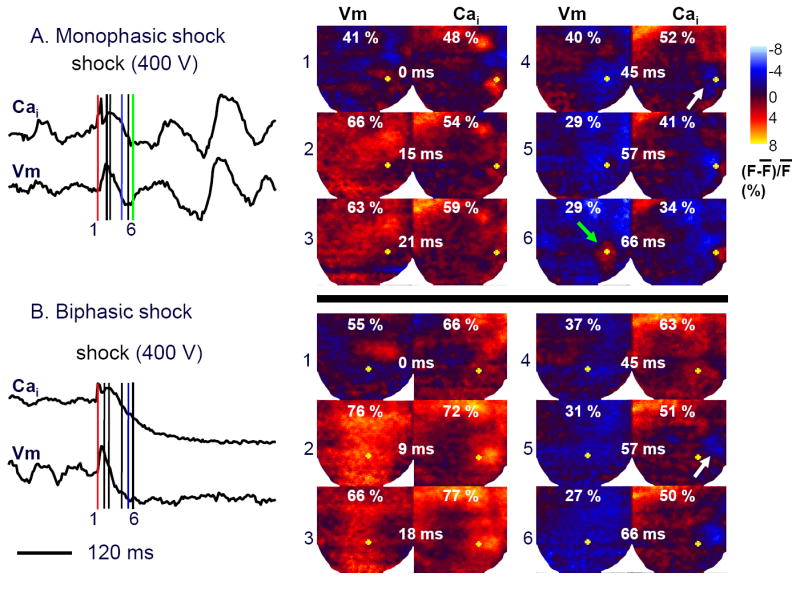
Figure 1. Dual optical mapping of failed defibrillation with MW and successful defibrillation with BW shocks.

Left panels of A and B show the time course of the average fluorescence of the entire mapped region following a MW (upper trace) or BW shock (lower trace). Right color panels show fluorescence intensity snapshots after a failed shock (400 V) delivered at 0 ms. Red, blue and green line segments indicate the time of shock, the time of Cai sinkhole formation and the end of the isoelectric window, respectively. The yellow dots on Vm maps are at the same location as the yellow dots on the Cai maps.
