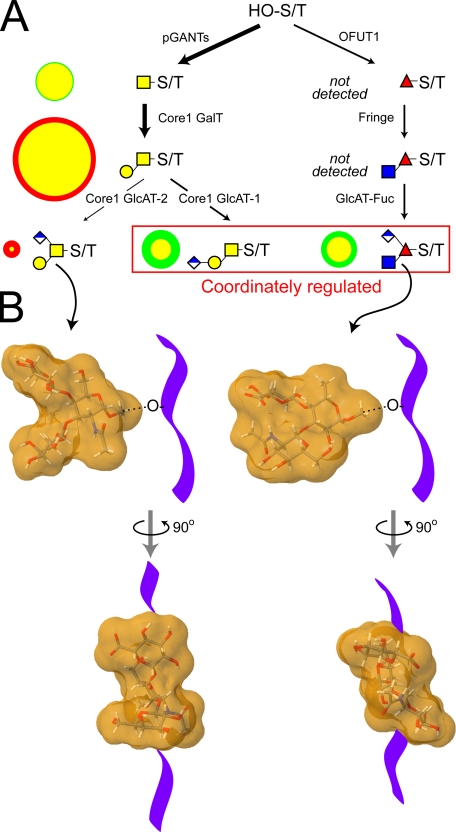
FIGURE 9.
Differential fluxes through the biosynthetic pathways that produce major O-linked glycans yield distinctive structural profiles in wild-type and fringe mutant embryos. Only a portion of the full complement of glycosyltransferases that are necessary for synthesizing Drosophila O-linked glycans have been identified. A, among the activities already identified in Drosophila are the pGANTs (ppGalNAcT) and the OFUTs (O-fucosyltransferases 1 and 2), which transfer monosaccharide directly to serine/threonine residues (HO-S/T) of the polypeptide backbone (9, 28, 90). To date, a single core 1 galactosyltransferase candidate has been characterized that can generate core 1 disaccharide, the predominant O-linked glycan of the embryo (96). The Fringe glycosyltransferase adds β3GlcNAc to O-Fuc on epidermal growth factor repeats (26, 30). The putative glucuronyltransferases necessary for generating the characterized glucuronylated O-glycans have yet to be identified (denoted here as core 1 GlcAT-1/2 and GlcAT-Fuc). In A, the arrow densities reflect predicted flux through pathways based on the relative prevalence of glycan products in wild-type embryos. To compare biosynthesis in fng mutant and wild-type embryos, circles to the left of each structure are drawn such that the area of the circle (green for wild-type and red for fng13 mutant) is directly proportional to the prevalence of that glycan (expressed as % total profile). For the two circles that describe the prevalence of an individual glycan in each background, the smaller is centered on top of the larger, and the area of overlap is coded in yellow. Therefore, a yellow circle rimmed in green indicates a glycan that is more prevalent in the wild type, and a yellow circle rimmed in red indicates a glycan that is more prevalent in fng13 mutant embryos. In the fringe mutant, the profile of the major acidic glycans shifts such that the relative prevalence of the branched core 1 trisaccharide increases in relation to both the linear core 1 trisaccharide and the O-Fuc trisaccharide. Coordinate regulation of these latter two glucuronylated structures, built on entirely different cores, is also apparent in the wing disc (see Fig. 6D). B, coordinate reduction of the branched O-Fuc trisaccharide and the linear core 1 trisaccharide, coupled to increased relative prevalence of the branched core 1 trisaccharide, shifts the distribution of glycan shapes on glycoprotein polypeptide backbones (diagrammed as a purple ribbon). Energy minimized models (supplemental Fig. 8) of the molecular shapes of the branched core 1 trisaccharide and the O-Fuc trisaccharide predict significantly different dispositions for their 3- and 4-linked substitutions (91, 92).5 The clustering of multiple O-glycans with distinct structural characteristics on mucins or on other types of polypeptide backbones may impart significant functional constraints to glycoproteins expressed in different cell types or in mutant backgrounds.

