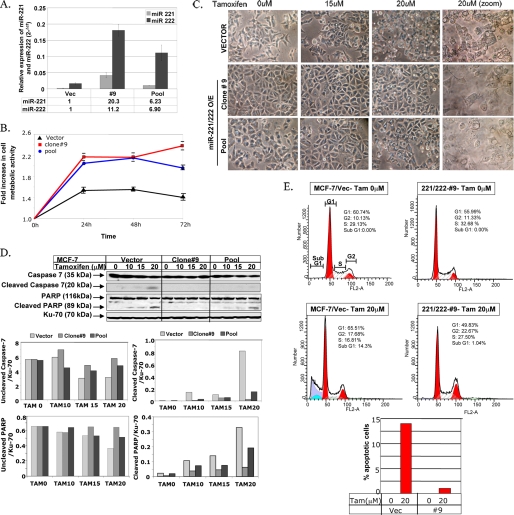
FIGURE 2.
Ectopic expression of miR-221/222 in MCF-7 cells results in increased tamoxifen resistance. A, expression of miR-221 and miR-222 was analyzed using total RNA isolated from miR-221/222-transfected MCF-7 cells by real-time RT-PCR and normalized to snRNA RNU6B. -Fold increase is shown below the bars. B, the G418-selected pool of miR-221/222-expressing MCF-7 cells, G418-selected clone 9 (MCF-7/221/222), and the empty vector-transfected MCF-7 cell pool were treated with 5 μm tamoxifen for 72 h. Cell metabolic activity in the presence of the drug was measured every 24 h using the MTT assay. The metabolic activity of cells at 0 h was taken as 1. The results are the means ± S.D. of triplicate assays. C, vector- and miR-221/222-expressing MCF-7 cells were treated with 0, 15, and 20 μm tamoxifen for 16 h. The cells were photographed using a phase-contrast microscope. O/E, overexpressing. D, whole cell extracts from the vector- and miR-221/222-transfected MCF-7 cells were separated by SDS-PAGE and probed with antibodies against PARP and caspase-7 that detect respective intact and cleaved products. The blot was reprobed with anti-Ku-70 antibody to ensure equal protein loading. The signal in each band was quantified using Kodak Imaging software. Quantification of both caspase-7 and PARP (uncleaved and cleaved) was plotted after normalization to Ku-70. The results are representative of two independent experiments. E, the vector- and miR-221/222-expressing MCF-7 cells were treated with 20 μm tamoxifen (Tam) for 24 h. The cells were fixed and stained with propidium iodide, and cell cycle distribution was monitored by flow cytometry in a FACSCalibur. The percentage of apoptotic cells (sub-G1 peak) in vector (Vec)- and miR-221/222-expressing cells is represented in the bar diagram. Similar results were obtained from three independent experiments.

