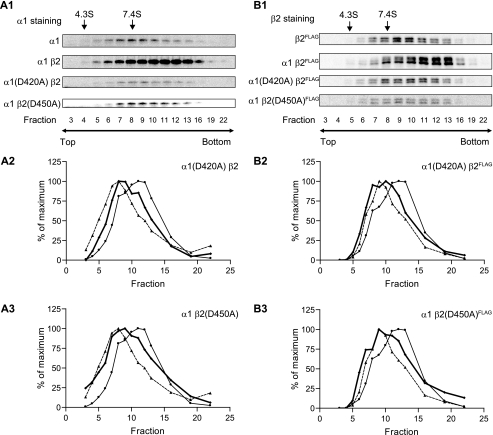
FIGURE 10.
GABAA receptor protein complexes were analyzed using sucrose density gradients. Whole cell lysates were extracted using high detergent RIPA buffer and subjected to 5–20% linear sucrose density gradients. Following centrifugation to separate protein complexes of different sizes, gradients were fractionated into 23 fractions from the top to bottom. 14 fractions were selected to analyze the sedimentation coefficients using Western blot and compared with proteins with known sedimentation coefficients (bovine serum albumin, 4.3 S; aldolase, 7.4 S). The chosen fractions are indicated beneath the Western blots. A1, representative Western blots of α1 subunit staining in single subunit (α1), α1β2, α1(D420A)β2, and α1β2(D450A) expression conditions are presented. A2, the distribution of protein complexes containing α1(D420A) subunits with α1(D420A)β2 subunit coexpression was plotted (bold line). The distributions of protein complexes containing α1 subunits with single subunit expression (dotted line with ▴) or α1β2 subunit coexpression (solid line with ▴) are included for comparison. A3, as in A2 except for protein complexes containing α1 subunits with α1β2(D450A) subunit coexpression. B1, B2, and B3, as in A1, A2, and A3, except that staining was for β2FLAG subunits using anti-β2 antibodies following immunoprecipitation with anti-FLAG M2 beads (to eliminate nonspecific staining; see Fig. 9).

