FIGURE 2.
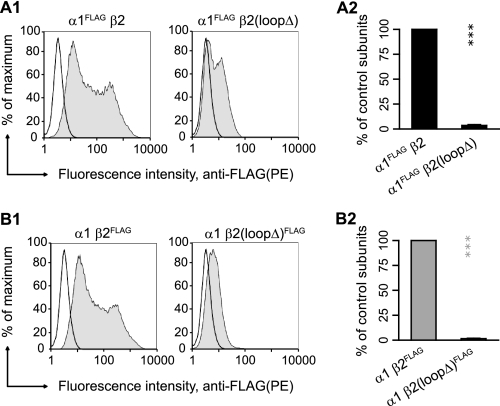
Deletion of the β2 subunit M3-M4 loop, β2K339-R451Δ, substantially reduced α1β2 receptor surface expression. A1, representative distributions of R-phycoerythrin (PE) fluorescence intensities for cells coexpressing α1FLAGβ2(left panel) or α1FLAGβ2(loopΔ)(right panel) subunits and stained with a R-phycoerythrin-conjugated monoclonal anti-FLAG antibody (M2 clone) were plotted as frequency histograms. The x axis indicates the fluorescence intensity in arbitrary units (note the log scale), and the y axis indicates the percentage of the maximum cell count. Representative distributions obtained from mock-transfected cells (unfilled histograms) are overlaid with each experimental distribution (filled histograms). A2, surface α1FLAG subunit levels were quantified using the fluorescence index (see “Experimental Procedures”) and plotted as a percentage of control α1FLAGβ2 subunit coexpression. B1 and B2, as in A1 and A2 except for cells coexpressing α1β2FLAG (left panel) or α1β2(loopΔ)FLAG (right panel) subunits. Values reported are mean ± S.D. *** corresponds to p < 0.001 compared with the control subunit coexpression.

