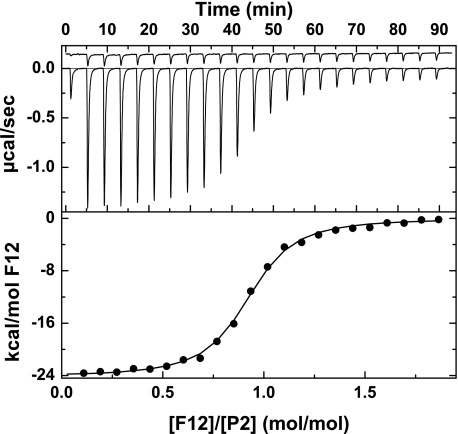
FIGURE 4.
Thermodynamic measurement of the binding of P2 to F12. Top, heat flow traces measured by isothermal titration calorimetry following sequential injections (10.1 μl) of 465 μm F12 into a cell containing 12.97 μm P2A195 (lower trace) or buffer (upper trace). The first injection was 2 μl. All components were in assay buffer lacking polyethylene glycol. Bottom, binding isotherm constructed by integrating the heat flow traces shown in the top. The line is drawn following analysis of the binding of F12 to independent and noninteracting sites using the fitted parameters listed in Table 1.

