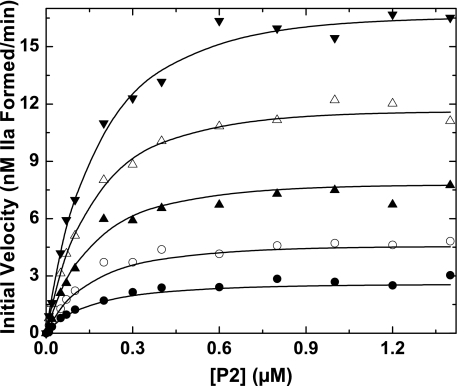
FIGURE 6.
Kinetics of P2 cleavage in the presence of F12. Initial velocities of thrombin formation were measured in reaction mixtures containing increasing concentrations of P2, 3.8 pm prothrombinase (3.8 pm Xa, 27 nm Va, 31 μm PCPSLUV) using concentrations of F12 fixed at 24 nm (•), 48 nm (○), 100 nm (▴), 200 nm (▵), and 500 nm (▾). The lines are drawn following analysis according to Scheme 2 using the fixed and fitted parameters listed in Table 2.

