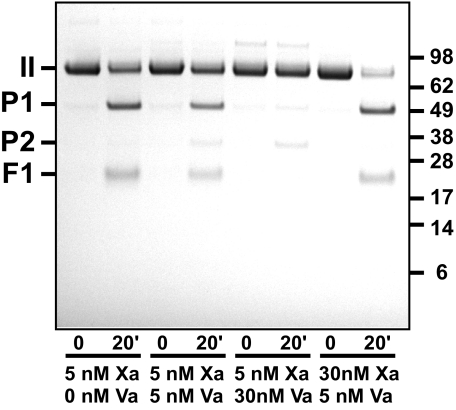
FIGURE 7.
Cleavage of prothrombin at Arg155 by Xa but not prothrombinase. SDS-PAGE analysis following incubation of 1.4 μm IIQQ with the indicated concentrations of Xa and Va and 50 μm PCPS. Bands denoted as P1 and F1 were identified by N-terminal sequence analysis. Traces of P2 evident following prolonged incubation with prothrombinase arise from slow but detectable cleavage at position 271 despite substitution of Arg with Gln. Migration positions of the molecular weight markers (Mr × 10-3) are indicated in the right margin.

