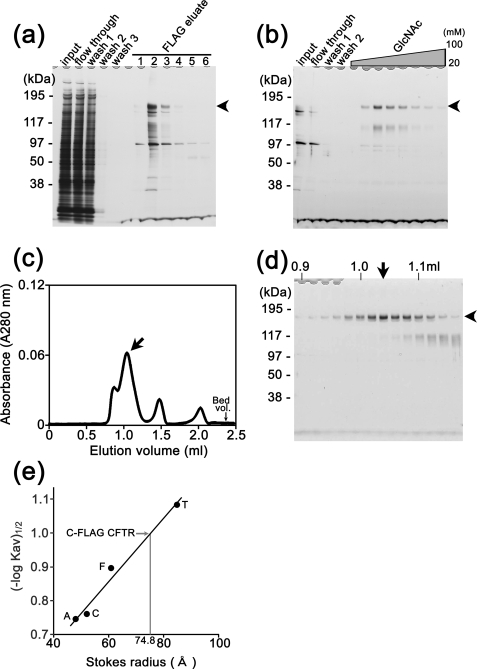
FIGURE 3.
Purification of the CFTR protein from transiently expressed HEK cells. Silver staining of aliquots at each purification step from anti-FLAG (a) and from WGA columns (b). Proteins bound to the WGA column were eluted by a linear gradient of GlcNAc from 20 to 100 mm. Bands of fully glycosylated mature CFTR are indicated by arrowheads. c, CFTR-rich eluates from the WGA column were concentrated using the Microcon YM-100 filter unit and analyzed by Superdex 200 SEC. CFTR was eluted in a sharp peak at 1.04-ml elution (indicated by an arrow). d, SDS-PAGE analysis of the SEC fractions. The intensity of the CFTR band in the gel corresponds to absorption in SEC. The fraction at 1.04 ml (arrow) was used for EM image analysis. e, from the elution volumes of CFTR and the standards, the RS of CFTR was calculated as 74.8 ± 1.1 Å (mean ± S.D., n = 5). T, thyroglobulin (RS, 85.0 Å); F, ferritin (RS, 61.0 Å); C, catalase (RS, 52.2 Å); A, aldolase (RS, 48.1 Å).

