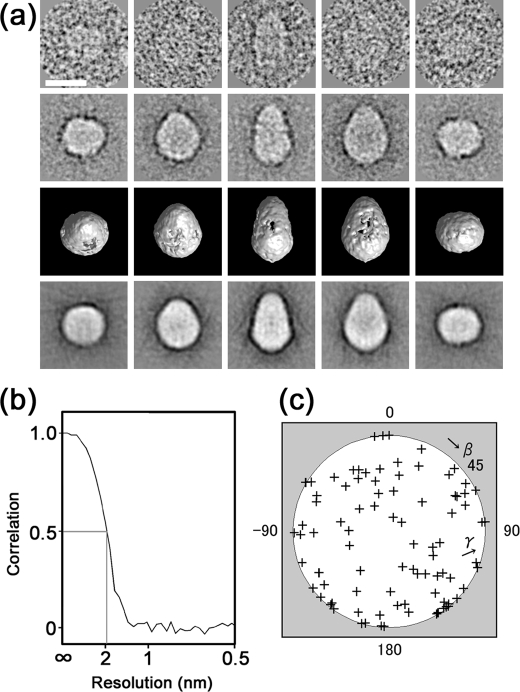
FIGURE 7.
Three-dimensional reconstruction of CFTR. a, raw images of CFTR with different Euler angles (row 1) are compared with the corresponding two-dimensional averages (row 2), the surface views of the three-dimensional reconstruction (row 3), and the reprojections of the three-dimensional reconstruction (row 4) consistent through the reconstruction. Protein is displayed in bright shades. The scale bars represent 100 Å. b, Fourier shell correlation function indicates the resolution limit of 2 nm by the Fourier shell correlation >0.5 criterion. c, plot of the Euler angles (β, γ) of 94 adopted class averages demonstrates almost random orientations of CFTR molecules on the carbon surface.

