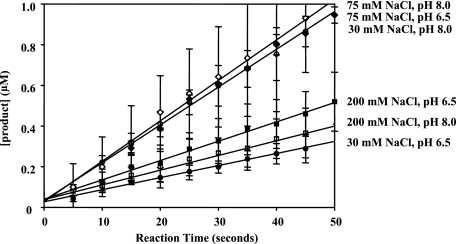
FIGURE 4.
Steady-state velocity curves for NS3-4A proteolysis of RET-S1 under a range of pH and salt conditions. The steady-state rates of proteolysis were 0.006 ± 0.001 μm product/s at pH 6.5, 30 mm NaCl (solid circles), 0.019 ± 0.001μm product/s at pH 8, 30 mm NaCl (pierced circles), 0.019 ± 0.001 μm product/s at pH 6.5, 75 mm NaCl (solid diamonds), 0.020 ± 0.001 μm product/s at pH 8, 75 mm NaCl (pierced diamonds), 0.010 ± 0.001 μm product/second at pH 6.5, 200 mm NaCl (solid squares), and 0.010 ± 0.001 μm product/s at pH 8, 200 mm NaCl (pierced squares). The active fraction in each case, as determined by intersection with the y intercept, was 68 ± 9% for pH 6.5, 30 mm NaCl, 84 ± 16% for pH 8.0, 30 mm NaCl, 84 ± 15% for pH 6.5, 75 mm NaCl, 70 ± 12% for pH 8.0, 75 mm NaCl, 95 ± 5% for pH 6.5, 200 mm NaCl, and 95 ± 5% for pH 8.0, 200 mm NaCl. The data shown were determined using NS3-4A of the 1b genotype and represent the steady-state data points fit to a line. Similar results were observed with NS3-4A (1a). This data are the average of three experiments and the error values represent standard deviation.

