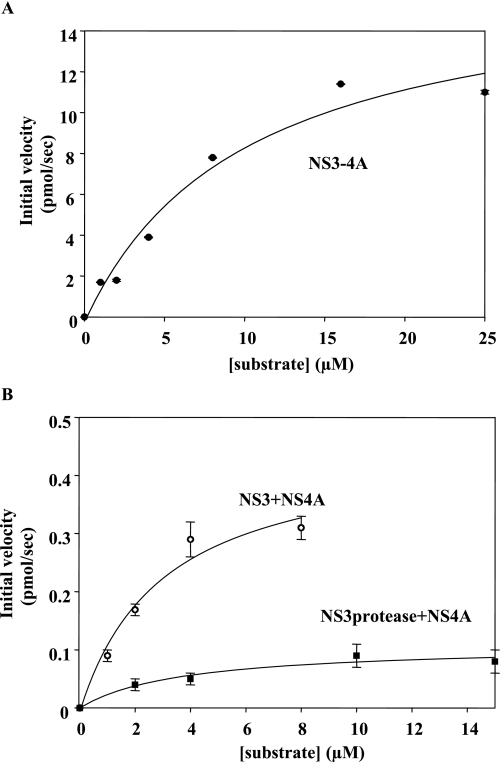
FIGURE 6.
Steady-state proteolysis rates of RET-S1 by NS3-4A, NS3 + NS4A, and NS3 protease domain + NS4A in the presence of varying substrate concentrations. The data were fit to the Michaelis-Menten equation to determine Km, Vmax, and kcat values. The data shown is the average of three experiments.

