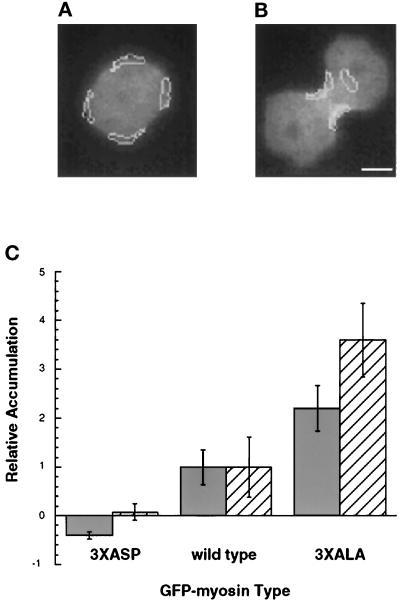
Figure 3.
Quantitation of myosin accumulation. The average fluorescence intensity within the indicated regions was calculated. (A) Four regions, shown by the white outline, were drawn on early mitosis cells, and their average intensity was taken as a measure of cortical myosin concentration. (B) In furrowing cells, the average intensity of two regions defining the furrow was taken as a measure of cortical furrow myosin concentration, and a region of perinuclear cytoplasm was used as a measure of cytoplasmic myosin concentration. Bar, 5 μm. (C) The amount of accumulation is shown normalized to those levels seen in GFP-myosin cells. Solid bars indicate the relative increase in myosin concentration in the furrow versus the adjacent cytoplasm as shown in Figure 4B. Striped bars indicate the relative increase in myosin concentration in the furrow (B) versus the cortex of the same cell in early mitosis as shown in Figure 4A. Bars, standard deviations.

