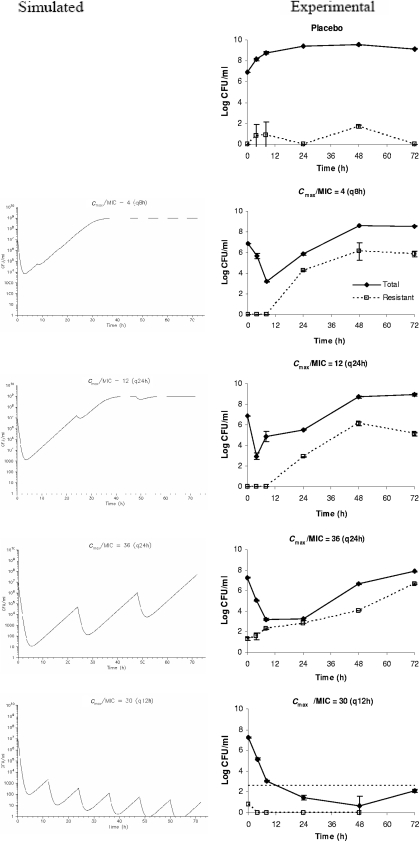
FIG. 4.
Comparison of computer-simulated and experimental bacterial (P. aeruginosa) responses to various gentamicin exposures. The dosing frequencies are in parentheses. The data are shown as means ± standard deviations. The horizontal dotted line [in Cmax/MIC = 30 (q12h)] depicts the reliable lower limit of detection.

