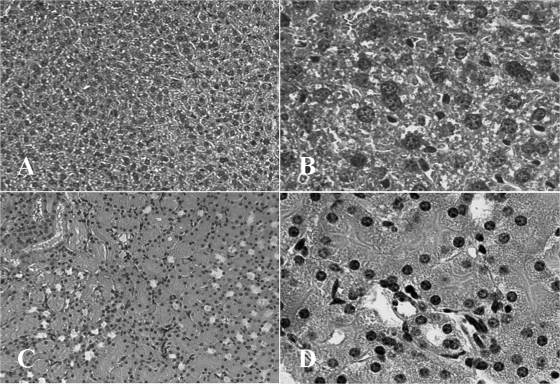
FIG. 2.
Liver and kidney tissue of mice treated with chlorpromazine. (A and B) Liver tissue from a mouse administered 20 mg of chlorpromazine/kg had hepatocytes of normal size and shape (A, ×100; B, ×400). (C and D) Kidney from a mouse administered 20 mg of chlorpromazine/kg had renal cortical tubules of normal size and shape (C, ×100; D, ×400). The tissues were stained with hematoxylin and eosin.

