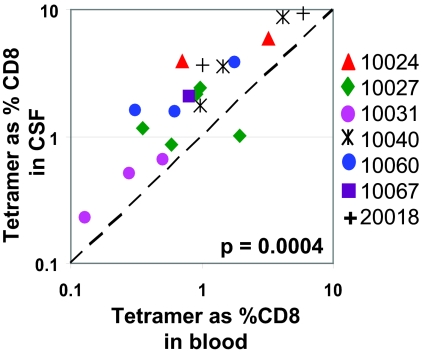
FIG. 2.
Relationship between frequencies of tetramer-positive CD8+ T cells among freshly isolated cells from CSF and blood. Frequencies of HIV-specific tetramer-positive CD8+ T cells among seven asymptomatic HIV-infected individuals are derived from plots shown in Fig. 1. Each data point represents an individual tetramer response for each participant studied. The diagonal dashed line represents the line of unity. The P value is derived from a two-tailed Wilcoxon matched-pairs t test.

