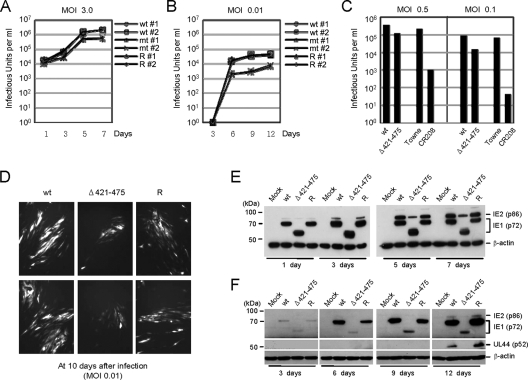
FIG. 4.
Analysis of the growth of recombinant viruses. (A and B) Analysis of growth curves in recombinant virus-infected cells. HF cells in 12-well plates were infected with wild-type, IE1(Δ421-475) mutant, or revertant virus at an MOI of 3 (A) or 0.01 (B) IFU/cell. The time course results shown represent the total infectious center units of infectious virus present in 2 ml of culture supernatant at the indicated sampling times. Note that the growth curves of wild-type and revertant viruses are indistinguishable, whereas those of mutant viruses (both 1 and 2) show different patterns (but almost identical) compared to those of wild-type and revertant viruses. (C) Comparison of viral growth between the IE1(Δ421-475) and CR208 viruses. HF cells were infected with the IE1(Δ421-475) and its parent viruses (reconstituted from the T-BAC clone), or the CR208 and its parent Towne viruses at an MOI of 0.5 or 0.1. At 5 days after infection, the total progeny virus titers were determined by measuring the numbers of IE2-positive infectious centers. (D) The images of GFP signals in infected cell cultures were taken at 10 days after infection at an MOI of 0.01 (IFU/cell). (E and F) Comparison of the accumulation of viral proteins in recombinant virus-infected cells. HF cells in six-well plates were infected with the recombinant viruses at an MOI of 3 (E) or 0.01 (F) IFU/cell. At the indicated time points, the total cell lysates were prepared and subjected to SDS-PAGE (8%), and immunoblotting was then performed with antibodies specific for IE1/IE2 and delayed-early p52(UL44) proteins. β-Actin was detected on the same blot as a loading control. wt, Wild type; R, revertant.

