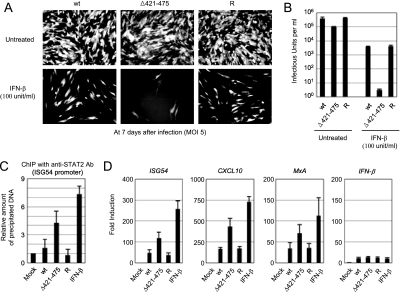
FIG. 5.
Comparison of the growth of recombinant viruses in cells pretreated with IFN-β. HF cells in 12-well plates were untreated or pretreated with 100 U of IFN-β for 24 h and then infected with wild-type, IE1(Δ421-475) mutant, or revertant virus at an MOI of 5 (IFU/cell). (A) The images of GFP signals in infected cells were taken at 7 days after infection. (B) The production of progeny virions at 10 days after infection from untreated and IFN-β-pretreated cells was measured by infectious center assays. The results shown are the mean values and standard errors of four independent experiments. (C) ChIP assays for the loading of STAT2 on the ISG54 promoter in cells infected with recombinant viruses were performed. HF cells were mock infected or infected with wild-type, IE1(Δ421-475), or revertant virus at an MOI of 2 IFU per cell for 12 h. As a positive control, HF cells were treated with IFN-β (1,000 U/ml) for 2 h. ChIP assays were conducted as described in Materials and Methods. The amounts of coprecipitated DNA were quantified by real-time PCR and normalized to input. The results shown are the mean values and standard errors of three independent experiments. (D) Expression of IFN-induced genes in cells infected with recombinant viruses. HF cells were infected with recombinant viruses or treated with IFN-β as in panel C. mRNAs for ISG54, CXCL10, MxA, and IFN-β were quantified by quantitative RT-PCR. The amounts of mRNAs in cells infected with viruses or treated with IFN-β over those in mock-infected cells are indicated as the fold induction. wt, wild type; R, revertant.

